|
Open-CMSIS-Pack
Version 1.7.59
Delivery Mechanism for Software Packs
|
|
Open-CMSIS-Pack
Version 1.7.59
Delivery Mechanism for Software Packs
|
Debug Description elements and access sequences are defined as IDE-independent. However the debug IDE can use this information to provide settings and to use sequences where applicable in its debug flow.
Arm μVision debugger (part of Keil MDK) supports CMSIS debug descriptions. If any of the debug description elements or debug access sequences are defined in a DFP for the target MCU the μVision automatically detects that and provides user with the configuration options described in this chapter.
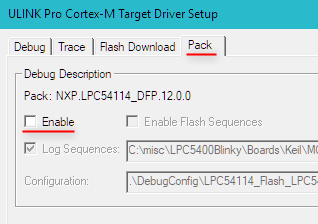
By default μVision enables the use of the debug descriptions if such are specified for the target. It is possible to manually disable the use of the debug descriptions for a specific project target in Options for Target... dialog - Debug tab - Settings button - Pack tab. If the item "Enable" is unchecked the debugger will ignore all device descriptions specified in the DFP:
When the use of debug descriptions is enabled various debugger configuration options can becomed locked as specified in the DFP. Section Impact of debug access configuration explains the debugger parameters that can be configured with the debug descriptions.
Disabling the use of debug descriptions can be useful to verify the default debugger behavior on the device.
When Default debugger configuration are provided the μVision debugger automatically applies these settings to the new project for the MCU. This can be observed in Options for Target... dialog - Debug tab - Settings button.
Below is an example of the configuration code and how it is applied by μVision.
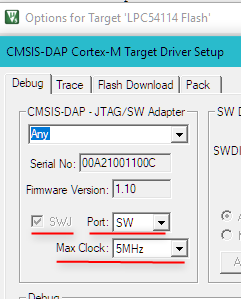
SWD is selected as the default debug protocol with 5MHz clock and SWJ checkbox locked because this is a fixed characteristic of the device.
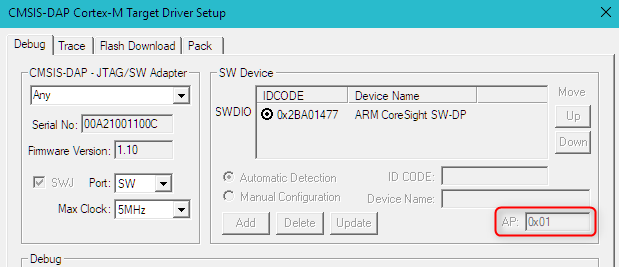
With the specificaton of the debug connection μVision debugger will automatically use the access port specified via the __ap attribute when debugging the processor and there's no need for user to configure it in the IDE. Corresponding option is locked as shown on the figure below.
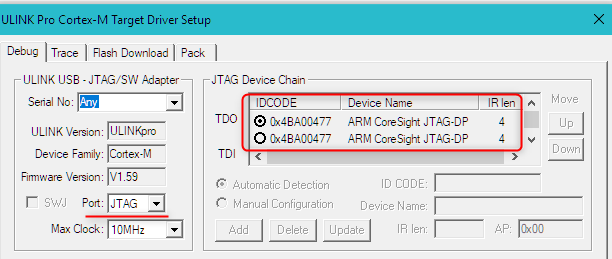
μVision debugger displays the JTAG ID Code and the IR Length values (actually read or overwritten ones) in debug settings:
You can test what the μVision debugger is able to detect automatically without the debugport configuration in the pdsc. For that the use of debug description shall be disabled in the Pack tab.
The default reset type can be specified in debug element via defaultResetSequence attribute.
It is also possible to disable particular reset type for selection by overwriting corresponding predefined reset sequence with disable attribute set to 'true'. For example reset configuration implemented for Microchip SAML11 device:
μVision debugger applies it automatically and displays as default and selected in Options for Target... dialog - Debug tab - Settings button and then Reset:
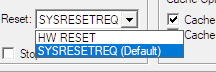
You can see the VECTRESET type is absent and system reset is selected and marked as default. The user can still manually change the reset type for the project in this dialog.
Using the Reset dropdown menu mentioned above a user can specify the reset type to be performed by the debugger.
Figure below shows how the typically available reset options map to the corresponding reset types in the connect flow described in Usage of debug access sequences. Note that "Custom" reset type appears only when user-defined debug sequence is assigned to the defaultResetSequence attribute.
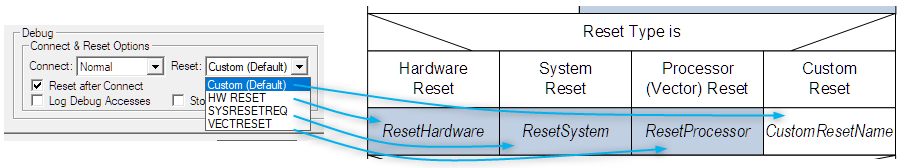
Detailed meanings for available options are explained in the documentation of corresponding debug adapter. For example for ULINKpro Connect & Reset Options
If the .pdsc file specifies for the target debugvars with the configfile attribute then μVision automatically creates an instance of debug configuration file for each target in the project by copying the *.dbgconf from the specified location in the pack to the DebugConfig directory in the application project.
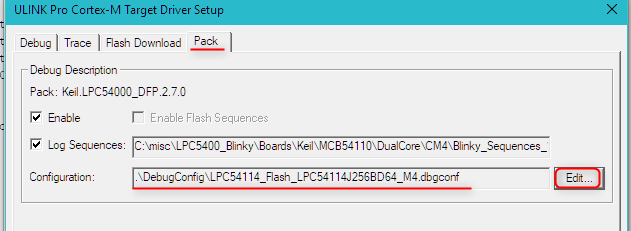
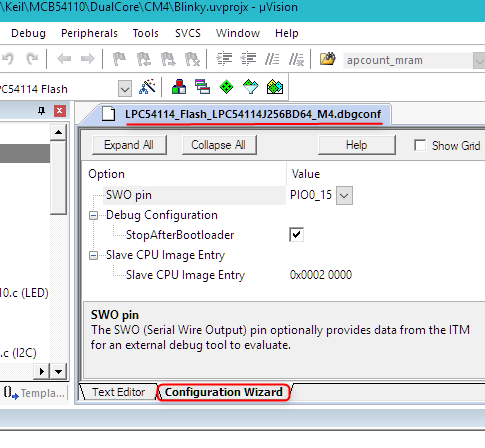
Clicking "Edit" button will open the debug configuration file in μVision for editing. If the .dbgconf file is written with the Configuration Wizard annotations the graphical view is available in μVision providing users with the intuitive configuration interface. For example:
μVision can save information about executed debug sequences into a log file. This can be useful when implementing debug sequences or analyzing debugger behavior.
The logging can be enabled via Options for Target... dialog - Debug tab - Settings button - Pack tab as shown on the figure below. The path and file name cannot be modified.
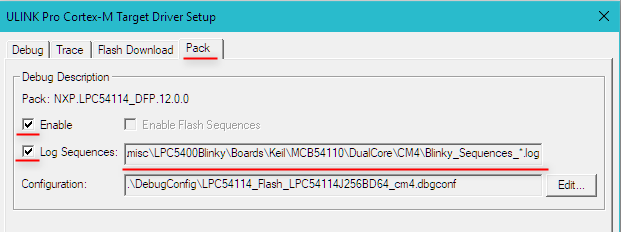
Note that the log file stores only debug sequences specified in the .pdsc file. The non-overwritten predefined debug sequences do not appear in the log but still get executed by the debugger.
Detailed information about the debugger operation can be obtained in the debug access log.
It can be enabled in Options for Target... dialog - Debug tab - Settings button as shown on figure below. The file is stored in the project root folder as <DebugAdapter>DebugLog<sequenceNr>.log file. For example: ULINKplus_DebugLog_0000.log.
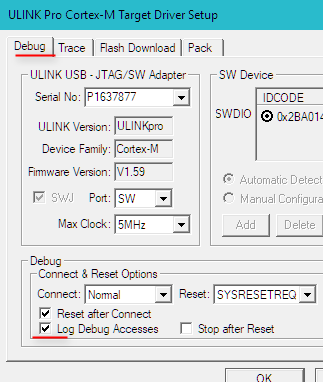
μVision debugger provides options to enable and configure debug connect and reset operations. Based on these settings decisions in the debug flow are made as shown in Usage of debug access sequences. Available configuration options depend on the debug adapters, but the approach is similar in most cases. Examples below explain the options available for ULINK and CMSIS-DAP adapters.
Use Options for Target... dialog - Debug tab - Settings button and then in Connect: dropdown menu select the option for debugger operation when establishing connection to the target.
Figure below shows how the options "with Pre-reset" and "under Reset" map to the corresponding operations in the connect flow described in Usage of debug access sequences.
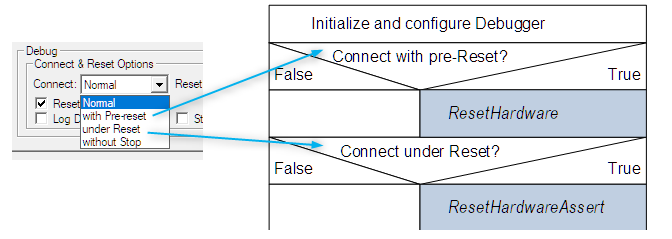
Detailed explanation for available options are can be found in the documentation of corresponding debug adapter. For example for ULINKpro Connect & Reset Options
Reset types and default selection explains the Reset dropdown menu in the same area and its mapping to the reset types used in Usage of debug access sequences.
The option is currently in experimental status.
